What is histogram
A histogram in a photograph is a graphical representation of a photograph and the level of light that helps to assess exposure. Before digital photography, we didn’t know if we had good exposure or not. Today you can see it on the camera display.
The image preview that your camera shows is good for checking your composition. The brightness and contrast of the image depend on both the settings on the LCD screen and changes in light conditions. The image you see in JPEG format does not show the full range of captured tones. The best way to determine exposure is to use a histogram.

How to use a histogram
If you know how to use the histogram, this tool will be an indispensable assistant for you during your photography.
There are two types of histograms on the camera. Luminosity histograms and RGB histograms. Both tools should be used for impact analysis.
Luminosity Histogram
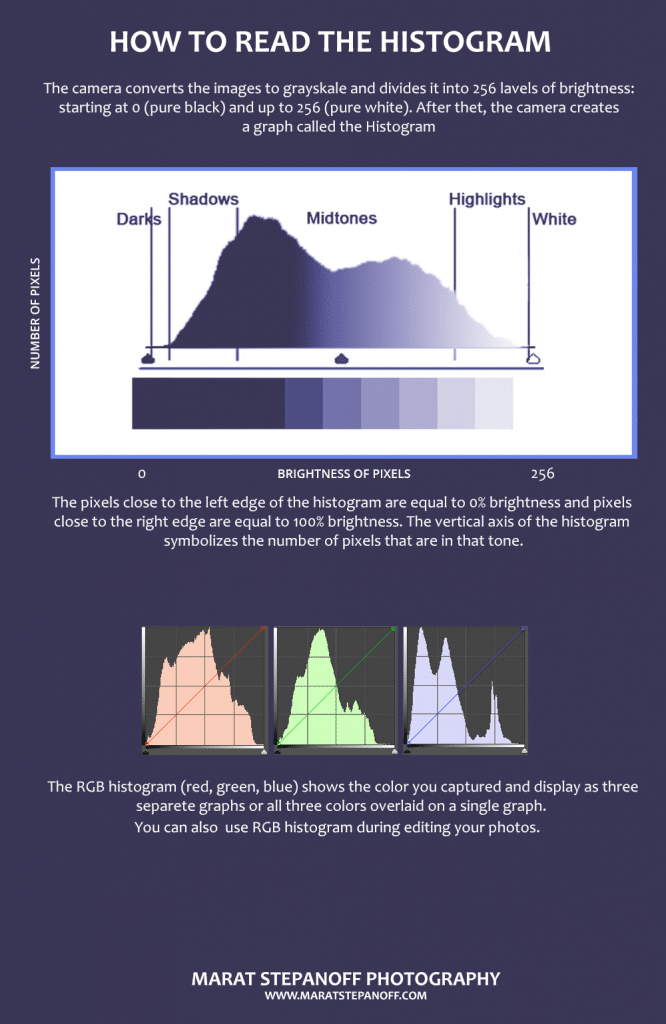
The Luminosity histogram shows the tone of black on the left side of the chart, and pixels close to the left edge of the histogram are equal to 0% brightness.
White is represented on the right side. Pixels close to the right edge of the histogram are equal to 100% brightness. Between them, there are middle tones, which are neither completely black nor white.
The vertical axis of the brightness histogram symbolizes the number of pixels in that tone.
RGB Histogram
The RGB histogram (red, green, blue) shows the color you have captured. The camera uses this color information to interpolate the actual color for that location on the sensor.
It also uses the color brightness to compile individual red, green, and blue histograms. The RGB histogram is displayed as three separate charts or all three colors overlaid on the same chart.
Mike Smith
How to read the Histogram
You should be able to read the histogram for proper use. The histogram is a visual hint from the photographer.
Black on the left, white on the right, and the middle tones between them.
Histogram Chart
Let’s take a look at the histogram chart.
The chart shows the brightness and RGB histogram. You can see shadows, shadows, halftones, highlights, and white pixels on the chart. This is a visual chart of the number of pixels in your picture.
There are also three histograms. This is an RGB histogram. These charts show the red, green, and blue pixels in your photo.
Usually, dark pixels are on the left, and light pixels are on the right.
Reading a histogram
By reading the histogram, you can accurately analyze the exposure during a photoshoot. On the exposure histogram chart, I show five typical histograms.
You must avoid overexposure and underexposure. Underexposure is an error. It’s most likely a night picture. This picture will be difficult to fix. Take a longer shutter speed.
Like underexposure, you should also avoid over-exposure. Information about the highlights and white is lost. This is not a quality photo.
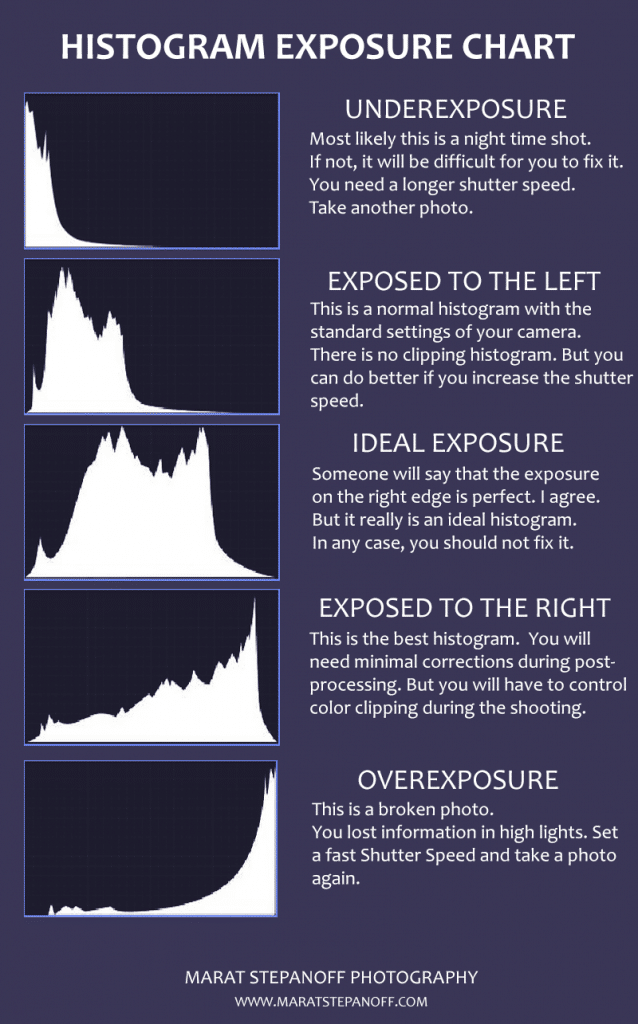
Ideal Histogram
The ideal histogram in photography is a graphical representation of the tonal values of the image of a certain brightness found in your photo, from black (more than 0%) to white (less than 100%).
Histogram clipping.
Clipping off a histogram is a “touch” of one of the graph edges.
- The main points are cut off if the graph touches the right side of the histogram. White details are absolutely absent in the image.
- Shadows are clipped if the graph touches the left part of the histogram. There are absolutely no black parts in the image.
- The color clipping is similar to highlights and shadows. The details of one of the colors are absent.
Learn more
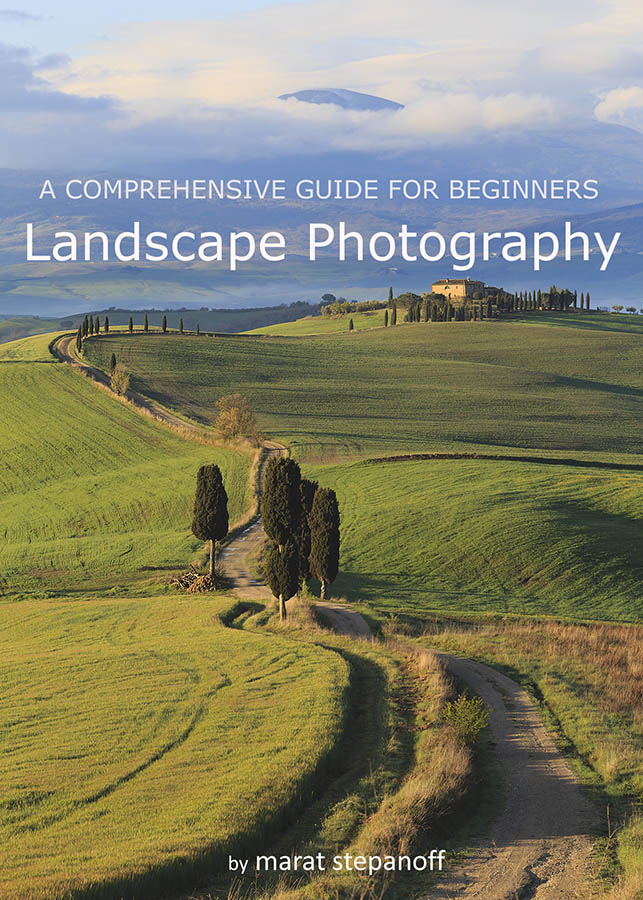
To improve your skills in landscape photography and learn how to take even more eye-catching images, my popular e-book, “Landscape Photography. The Complete Beginner’s Guide” will teach you the skills you need.
Regardless of your level, this ebook is written to start expanding your knowledge. “Landscape Photography. The Complete Beginner’s Guide” will teach you everything you need to start making beautiful images and take your photography to the next level.
Sorry. Rating area not clear. I meant to leave 5 star. This article is short, clear and useful with good illustrations.