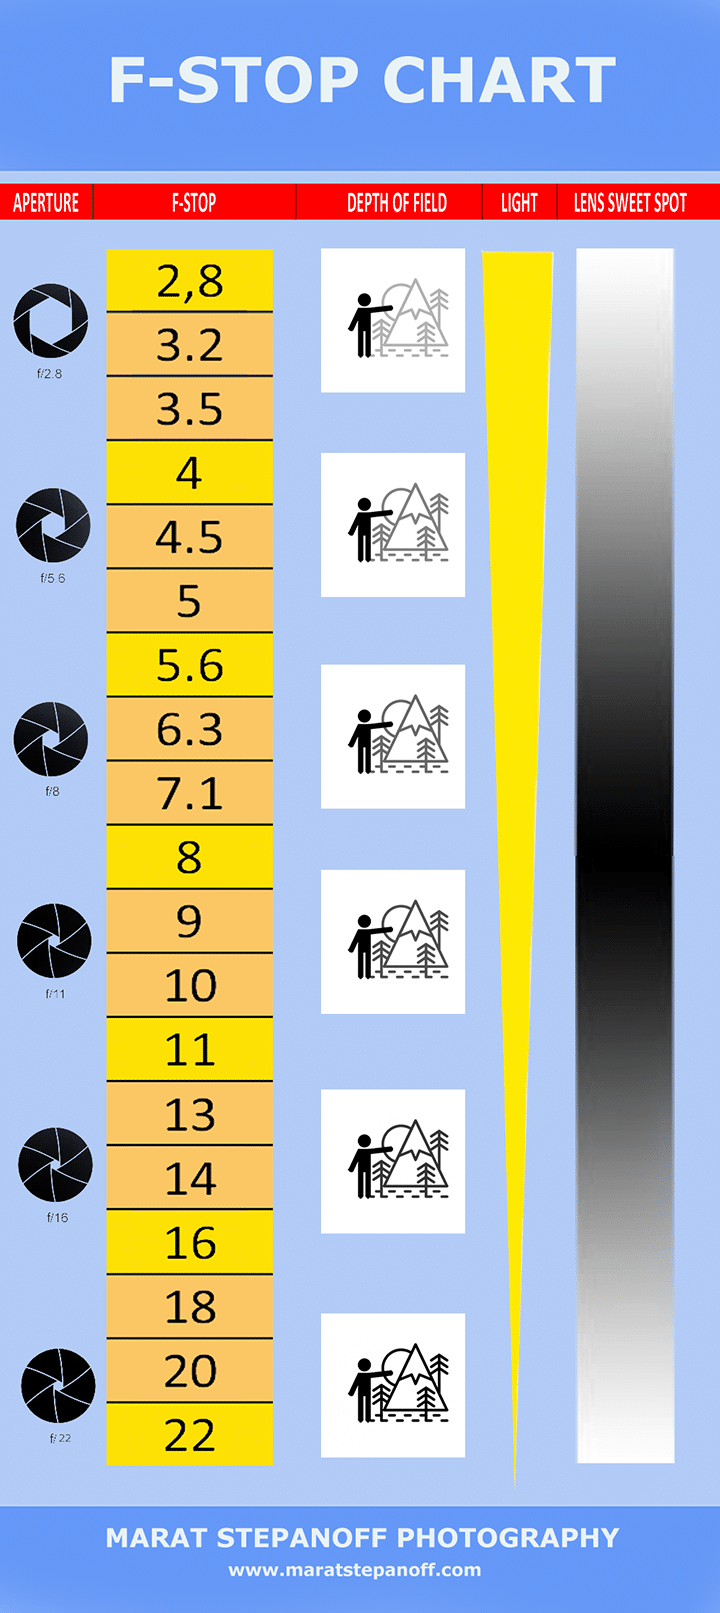
I created an F-Stop chart that illustrates the features of the photo’s aperture and its relationship to the F-stop, lens, light, and depth of field.

I wrote more about it here: F-stop and Aperture.
F-Stop Chart Infographic
Aperture
Aperture refers to the lens aperture size of the camera and is measured at f-stops.
When adjusting the aperture, note that when the numerical value of the aperture is increased, the aperture becomes smaller and the amount of light passing through decreases.
by Mike Smith
Full Stop – 1/2 Stop – 1/3 Stop
For most purposes, 1/2 stop is generally close enough, but some use 1/3 stop. There will be 2 numbers between two full stops. See more on F-Stop Chart.
Lens Sweet Spot
The lens sweet spot of a lens is the f-stop which to take optimally sharp shoots with the least distortion and diffraction. And get the best sharpness. It differs from one lens model to another.
The general rule is that should have retreated 2 f-stops away from the extreme aperture values.
Example: For my 24-70/4 (f4-f22) lens sweet spot is f/8 – f/11. F-Stop Chart illustrates the lens’s sweet spot for this lens.
Light
The bigger the hole, the more light passes through the lens for higher shutter speed. A slower opening results in long shutter speeds or darker photos.
Depth of Field (DOF)
Bigger the aperture the shallower Depth of Field. Smaller aperture makes the Depth of Field wider.
Also, you can read about f-stop in Wikipedia
Learn more
To improve your skills in landscape photography and learn how to take even more eye-catching images, my popular e-book, “Landscape Photography. The Complete Beginner’s Guide” will teach you the skills you need.
Regardless of your level, this ebook is written to start expanding your knowledge. “Landscape Photography. The Complete Beginner’s Guide” will teach you everything you need to start making beautiful images and take your photography to the next level.
Leave a Reply